ChartCraft
Paste data, build a chart, tweak the colors.
Live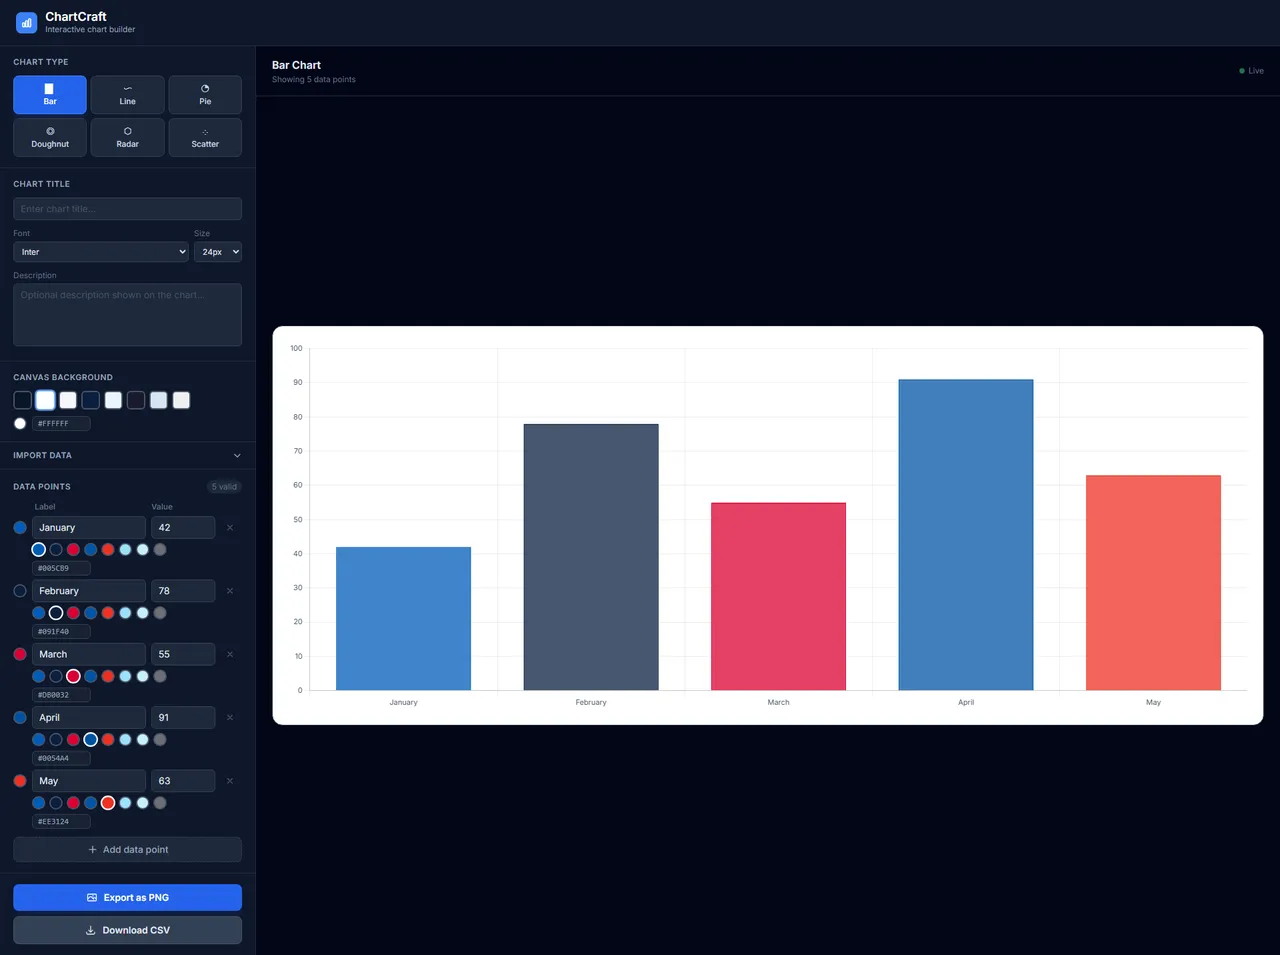
Summary
ChartCraft is a charting app for people who don't want to think about charting apps. Paste your data, pick a chart type, and adjust the styling with a built-in hex color picker. It started as the first project I built end-to-end in Claude Code and later became the demo I used to introduce the tool to non-technical teams.
Why it exists
Two reasons. One: I needed a real project to learn the Claude Code workflow on, something with enough surface area to exercise the CLAUDE.md + phased-prompts pattern, but small enough to finish. Two: it's the simplest possible thing to show a non-developer audience what AI-assisted coding actually produces. Everyone gets "paste data, see chart."
How it works
React app on the client. Paste CSV-like text, parse it in the browser, render with a chart library, expose styling controls (color, legend, axis labels) through a panel on the side. The custom hex picker exists because the off-the-shelf pickers all felt wrong.
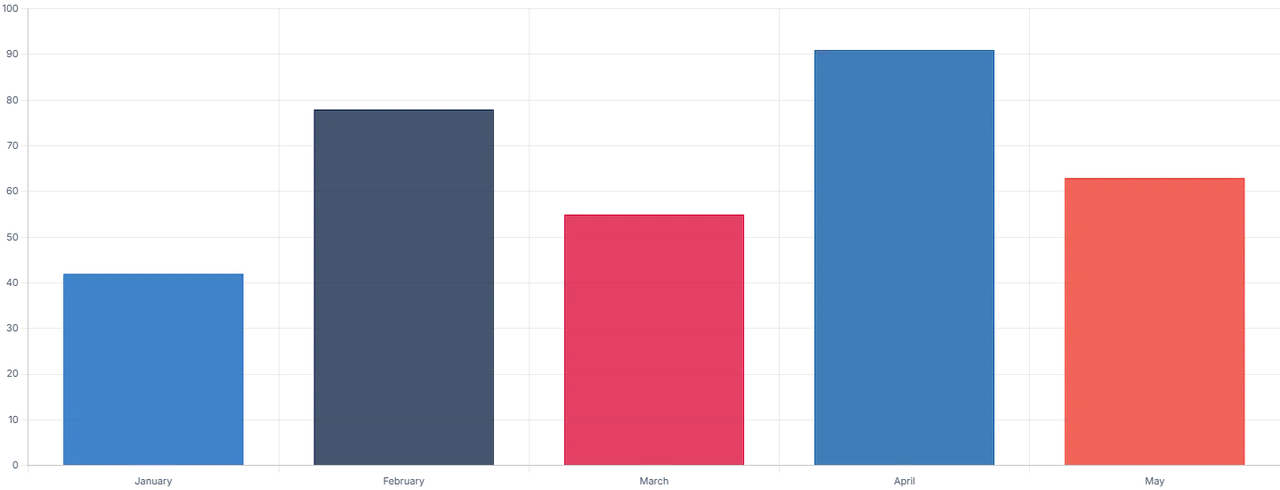
Here's the core loop, live and in your browser: paste whatever you'd copy from a spreadsheet, watch the chart redraw, and recolor the bars with the hex picker:
Stack
- React + Vite
- Tailwind CSS
Status
Live. Doubles as a Claude Code demo when people ask what the tool can do.